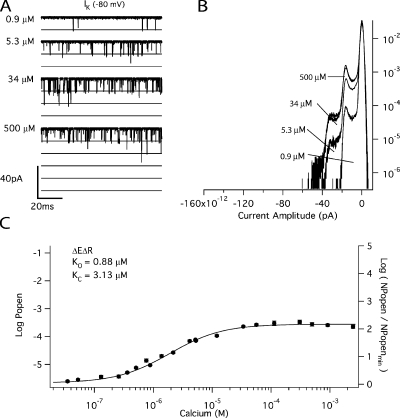
Figure 5.
The Ca2+ binding affinities of the Ca2+ bowl site at −80 mV. (A) Inward K+ currents recorded from mutant ΔEΔR at −80 mV and filtered at 10 kHz from a macropatch exposed to the indicated [Ca2+] demonstrate that Popen increases in a Ca2+-dependent manner when voltage is constant. The corresponding all-point amplitude histograms are plotted in B on a semi-log scale and were constructed from 30-s recordings as in Fig. 2. The dose–response relation for the effect of [Ca2+] on Popen (left axis) and NPopen/NPopenmin (right axis) at negative voltage (−80 mV) is shown in C. Each point represents the average of between 6 and 11 patches at each [Ca2+] tested. Log (NPopen/NPopenmin) spans the entire [Ca2+] range and is fit (solid line) by Eq. 6 yielding values of KO = 0.88 μM and KC = 3.13 μM. Error bars represent SEM.

