Figure 7.
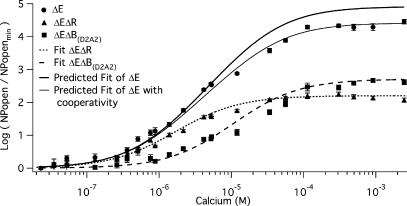
The two binding sites are less than additive. The mean log ratio of NPopen at −80 mV in the presence and absence of Ca2+ for mutants ΔE (solid circles), ΔEΔR (solid triangles), and ΔEΔB(D2A2) (solid squares) are plotted versus [Ca2+]. Various fits of log (NPopen/NPopenmin) are superimposed on the data. The fit of ΔEΔR also displayed in Fig. 2 is shown as a short dashed curve. The fit of ΔEΔB(D2A2) also displayed in Fig. 3 is shown as a long dashed curve. We simulated the log (NPopen/NPopenmin) relation (dark solid line) predicted by the affinities determined from each of the mutants using Eq. 5. The parameters of the fit were: KO1 = 0.88 μM, KC1 = 3.13 μM, KO2 = 4.88 μM, and KC2 = 23.2 μM. Also plotted (gray curve) is a fit that incorporates cooperativity between the binding sites. The equation for the fit was log (NPopen/NPopenmin) = ((1+(KO1+ KO2)+KO1KO2b)4) / ((1+(KC1+ KC2)+KC1KC2a)4). The parameters of the fit were: KO1 = 0.88 μM, KC1 = 3.13 μM, KO2 = 4.88 μM, KC2 = 23.2 μM, a = 1, and b = 0.75. Error bars represent SEM.

