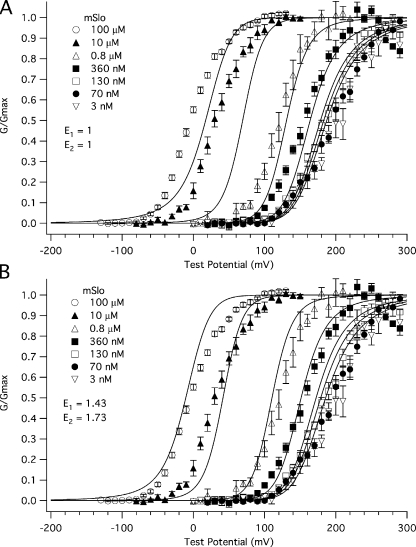
Figure 8.
Voltage likely affects the affinity of the BKCa channel for Ca2+. Shown are a series of mSlo1α G-V relations determined at the following [Ca2+]: 0.003, 0.070, 0.130, 0.360, 0.8, 10, and 100 μM and fitted simultaneously with the HA model modified to include two Ca2+ binding sites (Bao et al., 2002; Horrigan and Aldrich, 2002). Using values determined from this and previous experiments in our laboratory (Bao and Cox, 2005), the parameters were held as follows: KO1 = 0.88 μM, KC1 = 3.18 μM, KO2 = 4.88 μM, KC2 = 23.2 μM, LO = 2.2 × 10⁻⁶, zL= 0.41 e, Vhc = 151 mV, Vho = 27 mV, and zJ = 0.58 e. In A, the values of allosteric factors E1 and E2 were held to a value of 1 for both Ca2+ binding sites A and B. In B, the values of E1 and E2 were allowed to vary. The best fit values of E1 and E2 were 1.43 and 1.73, respectively.

