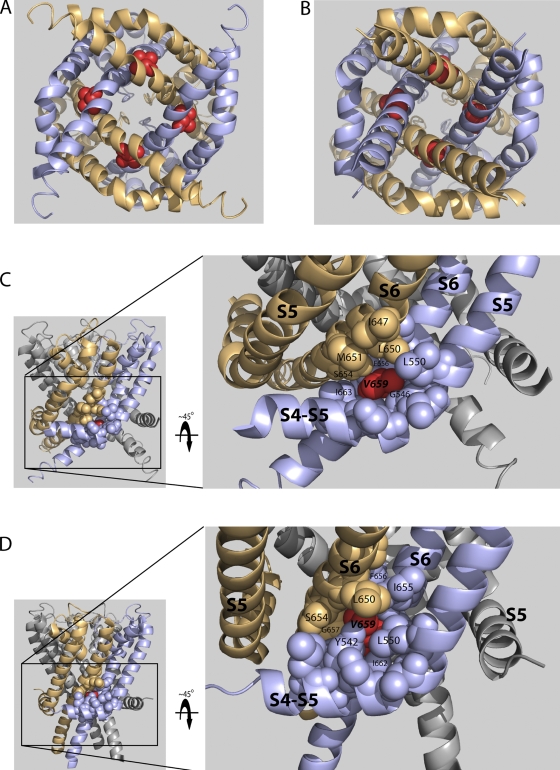
Figure 4.
Homology modeling of native V659 side chain orientation in closed and open states. (A) View from the cytoplasm of the open state homology model, illustrating V659 at the intersection of adjacent S6 domains and near the bundle crossing. The native V659 side chain is represented as red space–filled spheres, whereas the backbone α-helix is represented as either light blue or tan ribbon. For clarity, the S1–S4 domains are not shown. (B) View from the cytoplasm of the closed state homology model, with the V659 side chain near S6 domain and the S4-S5 linker. (C) Close-up view of the pocket surrounding the V659 side chain in the open state, tilted forward relative to views in A and B ∼45° about the S4-S5 linker. (D) Close-up view of the pocket surrounding the V659 side chain in the closed state.

