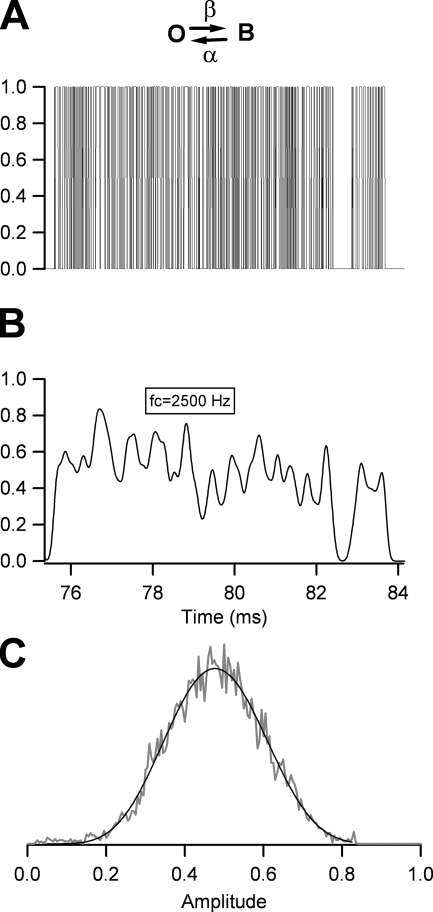
Figure 1.
Analysis of a fast two-state process with amplitude histograms and the β distribution. (A) Monte-Carlo simulation of the process with blocking rate β and unblocking rate α = 51,000 s−1. The simulation is set so that the amplitudes of the states in the scheme are O (open) = 1 and B (blocked) = 0. (B) The simulated data in A after filtering with a Gaussian filter with corner frequency, fc, of 2500 Hz. The data becomes smeared and the amplitude is reduced. (C) Amplitude histogram compiled from all the points from the trace in B (gray trace). The black trace is the fit of the β distribution to the data (Eq. 2) with parameters β = 51,200 s−1, α = 50,950 s−1, and τ = 0.418/fc.

