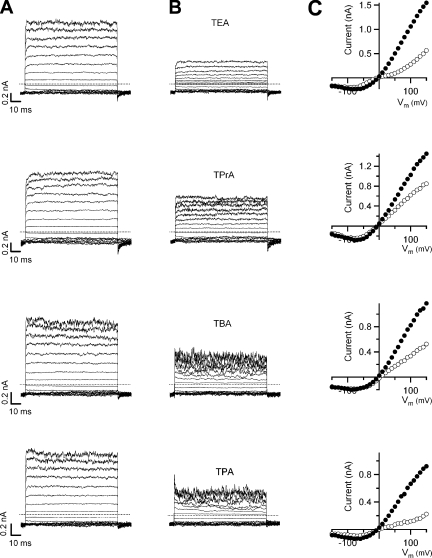
Figure 2.
Block of TRPV1 currents by intracellular QAs. Current traces without blockers (A) and with blockers (B). The currents were elicited by stepping membrane voltage from a 0-mV holding potential to −120 mV, and then to various test potentials from −150 to 150 mV in 10-mV increments. For clarity, only the traces at every 20 mV are shown. All current traces in B were obtained after applying the corresponding QA to the patch in A and corrected for leak current in the absence of agonist. The blocker concentrations used are: 10 mM TEA, 0.9 mM TPrA, 250 μM TBA, and 40 μM TPA. The dotted lines identify the zero current levels. (C) Steady-state current to voltage relations obtained from the traces in A (closed symbols) and B (open symbols).

