Figure 3.
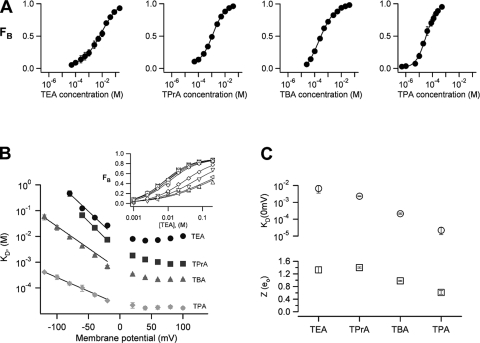
Voltage dependence and steady-state block at negative voltages. (A) Dose-response curves for the different QAs measured at a voltage of 100 mV. The solid lines represent fits to the Hill equation. The parameters are: TEA, KD = 8.7 ± 0.7 mM, s = 0.77 ± 0.08 (n = 5); TPrA, KD = 940 ± 60 μM, s = 0.79 ± 0.04 (n = 6); TBA, KD = 327 ± 25 μM, s = 0.88 ± 0.02 (n = 9); TPA, KD = 36 ± 8 μM, s = 1.15 ± 0.12 (n = 3). All recordings were performed in the presence of 4 μM capsaicin. (B) The apparent dissociation constant, KD, derived from data as in A at different voltages. The inset shows a complete dataset for TEA for voltages from −80 to 100 mV. Voltage dependence of block was determined at negative voltages by fitting Eq. 3 to the data in B up to −20 mV. (C) The parameters obtained from the fit are plotted as a function of the size of the blocker. KD at 0 mV (in units of M; top): TEA, 6.65 × 10⁻³ ± 3.10−3 (n = 4); TPrA, 2.31 × 10⁻³ ± 0.11 × 10⁻³ (n = 4); TBA, 21.3 × 10⁻⁵ ± 1.7 × 10⁻⁵ (n = 6); TPA, 2.2 × 10⁻⁵ ± 10−5 (n = 5). The values of Z (bottom) are (in units of eo): TEA, 1.32 ± 0.097; TPrA, 1.4 ± 0.02; TBA, 0.98 ± 0.02; TPA, 0.61 ± 0.06. The affinity of the channel for the blockers increases with blocker size. Group data are presented as mean ± SEM.

