
Figure 4.

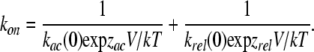
Kinetics of block by intracellular TEA determined with the β distribution. (A) Single-channel openings in the absence (top trace) and in the presence of 2, 5, and 20 mM TEA obtained at 60 mV. The apparent current amplitude decreases as the TEA concentration is increased, as predicted for a fast blocker. The dashed line represents the closed-channel current level, and the dotted line is the mean open-channel level in the absence of TEA. (B) Normalized amplitude histograms obtained from traces as in A. Solid lines are fits to the β distribution with the following parameters: 2 mM, β = 26,679 s−1, α = 61,454 s−1; 5 mM, β = 43,001 s−1, α = 55,882 s−1; 20 mM, β = 156,370 s−1, α = 44,582 s−1. (C) Blocking rate constants obtained from the fits to the β distribution as in B from three separate patches at several voltages and blocker concentrations. The on-rate, kon, increases with voltage and reaches a plateau. The solid line is a fit to a double exponential function reflecting both the voltage dependence of the on-rate and of the relief of block and has the form
The values of the fit parameters are: kac(0) = 1.171 × 10⁶ M−1s−1; zac = 1.0193; krel(0) = 4.722 × 10⁷ M−1s−1; zrel = 0.48. The off-rate decreases with increasing voltages but starts to increase at voltages more positive than 60 mV. The values of kon and koff at 0 mV were estimated from an exponential fit to the data between 240 and 60 mV, and the parameters of the fit are: kon(0) = 1.04 × 10⁶ M−1s−1; z = 0.94 eo; koff(0) = 28,950 s−1; z = 0.27 eo. Group data are presented as mean ± SEM.
 |