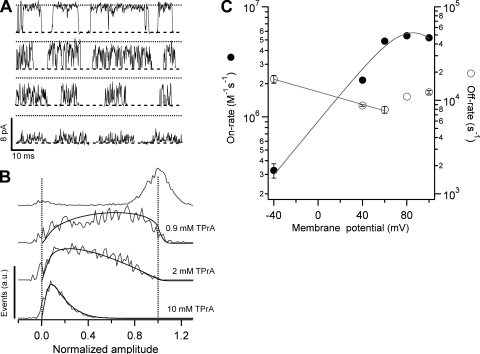
Figure 5.
Kinetics of TPrA block. (A) Single-channel openings in the absence (top-most trace) and presence of 0.9, 2, and 10 mM TPrA obtained at 60 mV. The current amplitude decreases as the TPrA concentration is increased, as expected for a fast blocker. The dashed line represents the closed-channel current level, and the dotted line is the mean open-channel level in the absence of TPrA. (B) Normalized amplitude histograms obtained from traces as in A. Solid lines are fits to the β distribution with parameters: 0.9 mM, β = 8,571.7 s−1, α = 7,315.9 s−1; 2 mM, β = 8,563 s−1, α = 12,193 s−1; 10 mM, β = 11,198 s−1, α = 49,061 s−1. (C) Blocking rate constants obtained from the fits to the β distribution as in B in three different patches at several voltages and blocker concentrations. The on-rate increases with voltage and reaches a plateau. The off-rate decreases with increasing voltages but starts to increase at voltages more positive than 60 mV. The solid line is a fit to a double exponential as in Fig. 4. The values of kon and koff at 0 mV were estimated from an exponential fit to the data between −40 and 60 mV, and the parameters of the fit are: kon(0) = 8.6 × 10⁵ M−1 s−1; z = 0.69 eo; koff(0) = 1.23 × 10⁴ s−1; z = −0.19 eo. Group data are presented as mean ± SEM.

