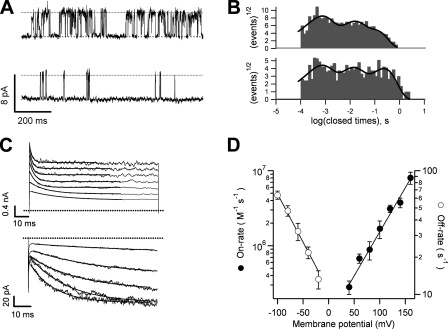
Figure 7.
Kinetics of block by TPA. (A) Single-channel traces in the absence (top trace) and presence of 80 μM TPA (bottom trace). (B) Closed time histograms from multiple traces as in A fitted with three exponential components. (C; top) Macroscopic kinetics of block during depolarizing voltage pulses ranging from 40 to 160 mV in the presence of 40 μM TPA. The onset of block can be seen as an exponential decay of the initial current, as expected for a slower blocker. (Bottom) Blocker dissociation observed during tail current experiments. Traces were obtained in the presence of 80 μM TPA at −20, −40, −60, −80, and −100 mV. Blocker dissociation can be seen as an exponential increase in the current. The off-rates were obtained from fits to an exponential (solid lines). (D) The on- and off-rates obtained from traces as in C, plotted as a function of voltage. Both rates are voltage dependent and have the following values estimated from an exponential fit to the data: koff(0 mV) = 10.73 s−1 (n = 3); zoff = 0.45 eo; kon(0 mV) = 1.03 × 10⁵ M−1s−1 (n = 5); zon = 0.68 eo. Group data are presented as mean ± SEM.

