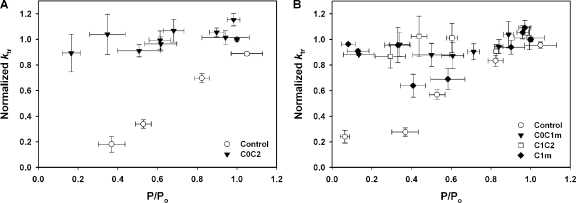
Figure 7.
Effects of recombinant N-terminal proteins on rates of tension redevelopment (ktr) relative to changes in force. (A) 5 μM C0C2 (triangles; n = 6) increased ktr to near maximal at all levels of submaximal Ca2+ activation. (B) 5 μM C0C1m (triangles; n = 4) and 5 μM C1C2 (squares; n = 4) increased ktr to near maximal at all levels of submaximal Ca2+ activation, whereas 5 μM C1m (diamonds; n = 6) increased ktr to near maximal only at values at or below the pCa50 for force generation.

