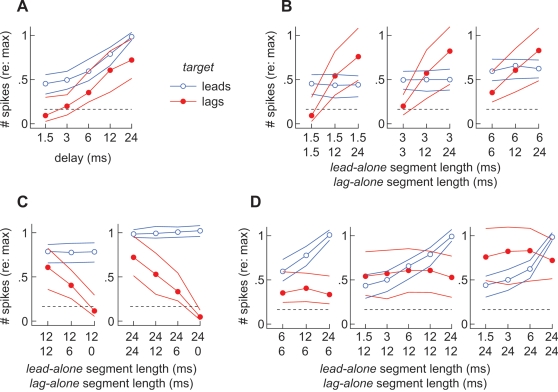
Figure 4. Summary of overall neural responses to lead and lag targets.
(A) Responses evoked in the standard paradigm in which lead-alone and lag-alone segments were of equal length. (B) Responses evoked when lag-alone segments were experimentally lengthened. At each point along the abscissa, the number on top indicates the length of the lead-alone segment. The number underneath indicates the length of the lag-alone segment. (C) Responses evoked when lag-alone segments were experimentally shortened. (D) Responses shown here have been regrouped so that the length of the lag-alone segment is constant within each panel. All data points represent the median number of spikes evoked when the target led (blue lines) or lagged (red lines). Thin lines indicate the first and third quartiles of each response. Each value is normalized to the average response evoked, in each cell, by 30 ms sounds (>50 repetitions) presented from the center of its SRF [11]. The dashed horizontal line represents the median response evoked by two, simultaneous, uncorrelated, noise-bursts from target and masker loci.

