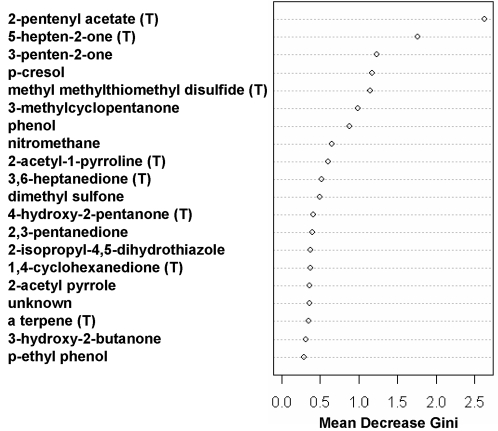
Figure 3. Endogenous compound ranked by their importance in discriminating MHC types across diets.
The importance measure is assessed by mean decrease in the Gini index (higher values are more important), a relative measure of group (MHC) differences explained. See the text for details. (T) = tentatively identified from mass spectral data.

