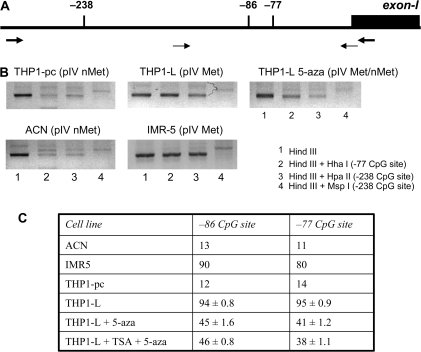
Fig. 4.
Hyper-methylation of AIR-1 pIV as the major cause of lack of CIITA expression in response to IFN-γ. (A) Schematic representation of the AIR-1 p-IV region. Thick arrows indicate the positions of the primers used to analyse CpG sites by semi-quantitative restriction analysis; thin arrows indicate the positions of the primers used to analyse CpG sites by quantitative pyrosequencing. CpG sites under investigation are shown as vertical bars: sites −238 (HpaI MspI) and −77 (HhaI) were studied by restriction analysis; sites −86 and −77 were studied by quantitative pyrosequencing. (B) Semi-quantitative analysis of two CpG sites by restriction enzyme digestion. THP1-pc (pIV nMet), THP-1 parental cells with a non-methylated pIV; THP1-L (pIV Met), the THP1 variant with a fully methylated pIV; THP1-L 5-aza (pIV Met/nMet), the THP1-L variant treated with 5-aza showing a significantly reduced methylation of pIV. IMR5 and ACN are two neuroblastoma cell lines chosen as control of methylated (Met) and non-methylated (nMet) AIR-1 p-IV, respectively (15). The results shown are from one representative experiment of two with similar results. (C) Quantitative analysis of two CpG sites by pyrosequencing. ACN, IMR5 and THP1-pc were analysed in duplicates (mean value), THP1-L, THP1-L + aza and THP1-L TSA + aza were analysed in triplicate (mean value ± SD). Values are expressed as percentage of methylation at the two sites.

