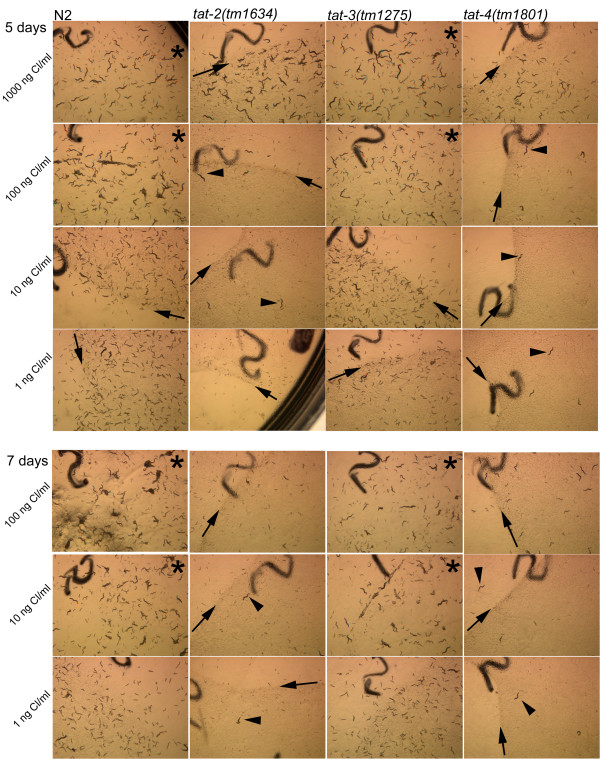
Figure 8.
Sterol deprivation sensitivity of mutant and N2 nematodes. Notations: arrows indicate the edge of food lawn on plates that still have bacterial food; arrow heads point to the first generation animals; stars identify plates that began starving. The dark lines on the photographs are numbers written on the underside of plates.

