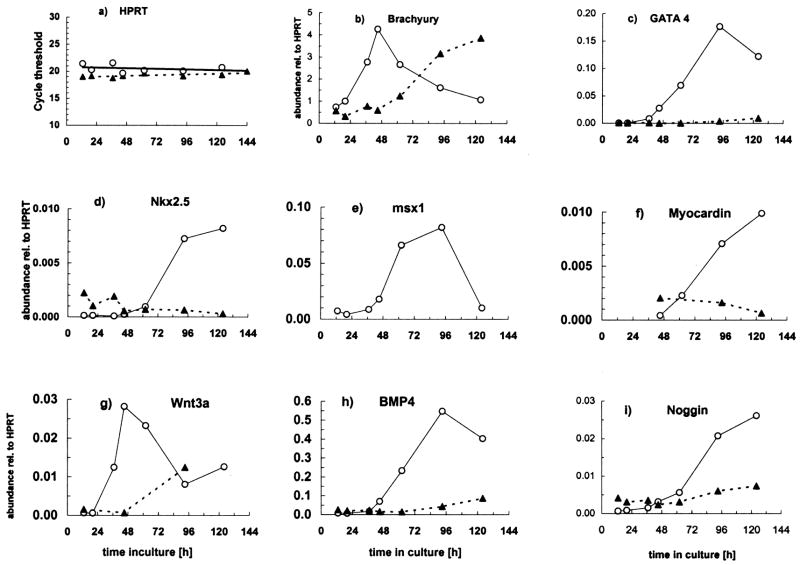
Fig. 5.
Effect of aggregation on P19-SI cell gene expression patterns. P19-SI cells were grown in monolayer (
 ) or mass aggregate (
 ) cultures. Samples were harvested from 13–124 hrs and assayed by quantitative RT-PCR to detect expression of the early mesodermal marker, Brachyury T; known cardiac transcription factors (Nkx 2.5, GATA 4, Myocardin); the cardiogenic signaling molecule, BMP 4; Noggin, Wnt 3a and Msx-1. Data in b) through i) are normalized to HPRT (a) expression. Msx-1 mRNA was not measured in monolayer cultures. See text for complete discussion.

