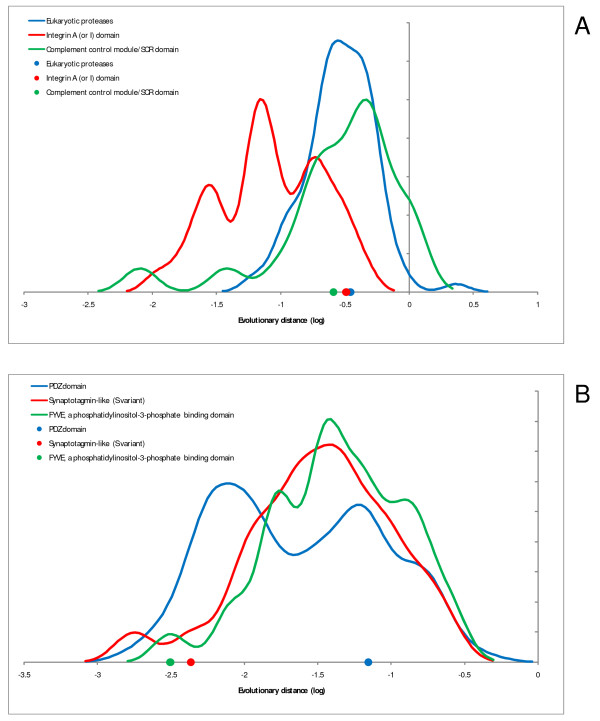
Figure 4.
Examples of domain evolutionary rates in multidomain proteins. A – complement component 2 precursor (C2; NP_000054). B – protein regulating synaptic membrane exocytosis 2 (RIMS2; NP_001093587). The curves indicate the rate distributions for the constituent domains of multidomain proteins (as in Figure 2 dots indicate the rates for the corresponding domains (color-coded) in the given protein.

