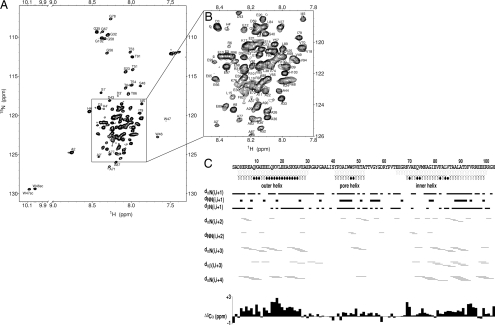
Fig. 2.
NMR structural analysis of WSK3. (A) Representative [1H,15N]-HSQC spectrum of WSK3 in 95% H2O and 5% D2O acquired at 293 K and 16.5 T. (B) A zoom-in view of the crowded region in A. (C) NOESY connectivity with line thickness proportional to cross-peak intensities. Also shown are the Cα chemical shift index and helical regions in KcsA (light gray) and in WSK3 (black). The filled circles below the sequence mark the residues where backbone hydrogen-bond restraints were imposed on the basis of unambiguous temperature dependence of exchangeable amide protons.

