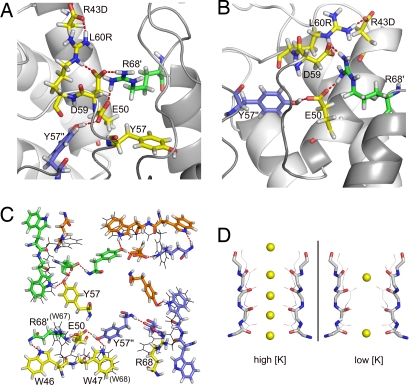
Fig. 3.
Stabilization of the selectivity filter and tetramer conformation in WSK3 by a network of salt bridges and hydrogen bonds. Important side chains are depicted in the licorice representation, with hydrogen bonds indicated by red dashed lines. (A and B) The same region is depicted from different viewing angles. (C) Quaternary relationship among W46, W47, E50, Y57, and R68 in WSK3. W67 and W68 in KcsA are shown in black lines for comparison. (D) Comparison of the selectivity filter between WSK3 structure and KcsA crystal structures obtained in the presence of high (1K4C) and low (1K4D) K+ concentrations. WSK3 is depicted in thick sticks and KcsA in thin lines. Element colors: C, gray; N, blue; O, red; and K, yellow. K+ locations are taken from the crystal structures and not from the NMR data.

