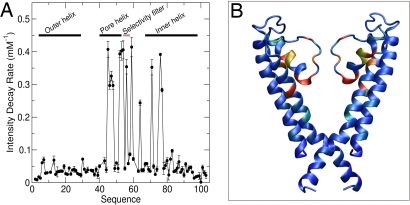
Fig. 5.
Effects of ionic strength on WSK3. The rate of NMR intensity decay with increasing ion concentration is plotted as a function of sequence number (A) and color-coded onto the WSK3 structure (B). In B, two subunits are removed for display clarity. Most- to least-affected residues are color coded from red to blue.

