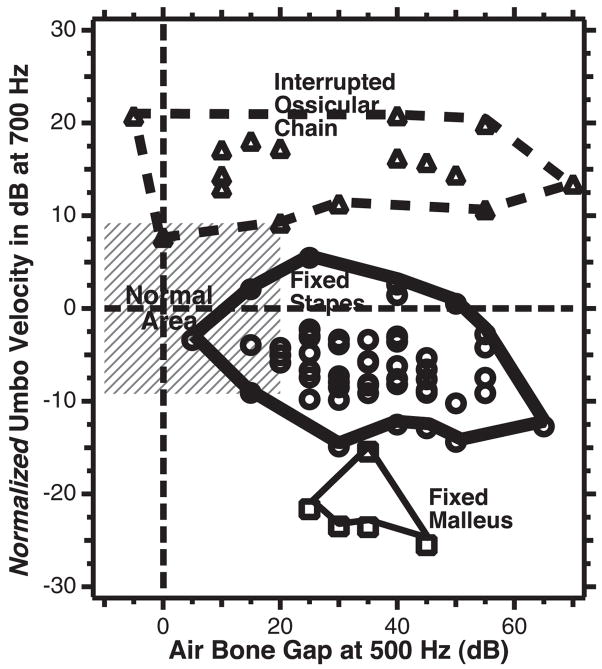
Fig. 11.
A plot of normalized umbo velocity (the difference in umbo-velocity transfer-function magnitude from the mean normal value) at 700 Hz on the ordinate scale vs. the air-bone gap at 500 Hz for each of the individual ears in the three groups of ossicular disorders: Fixed-stapes ear data are shown as circles, fixed malleus as squares, and ossicular interruption as triangles. The thin dashed horizontal line marks the contour associated with mean normal umbo velocity. The thin dashed vertical line demarcates the contour associated with a 0 dB air-bone gap. The gray area outlines the region of air-bone gap less than 20 dB and an umbo velocity that is within two standard deviations of normal. The thicker lines are used to circumscribe the results from the three ossicular disorders.

