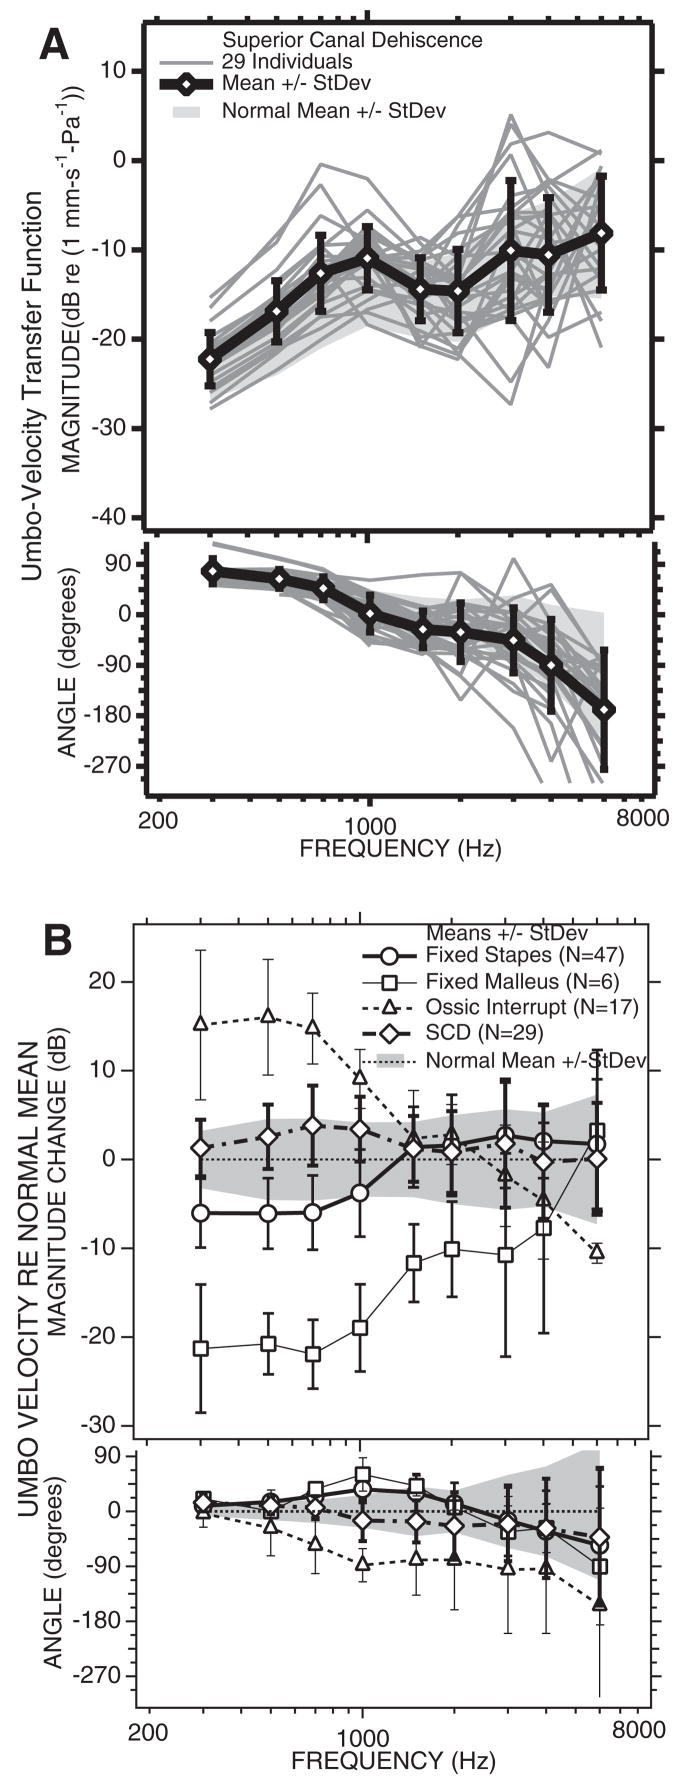
Fig. 13.
LDV results from 29 ears with SCD. A, The umbo-velocity transfer-function magnitude (upper panel) and angle (lower panel). The mean is plotted as open diamond and thick lines. The cross bars represent ±1 standard deviation. The gray-shaded region is the normal mean ±1 standard deviation. B, The mean difference in umbo velocity from normal in: 29 ears with SCD, the line with longer dashes and open diamonds; 47 ears with fixed stapes, the open circles, and solid lines; 5 ears with fixed malleus, the squares, and the thinner solid line; 17 ears with ossicular interruption, the triangles, and the dashed line. The bars represent ±1 standard deviation.

