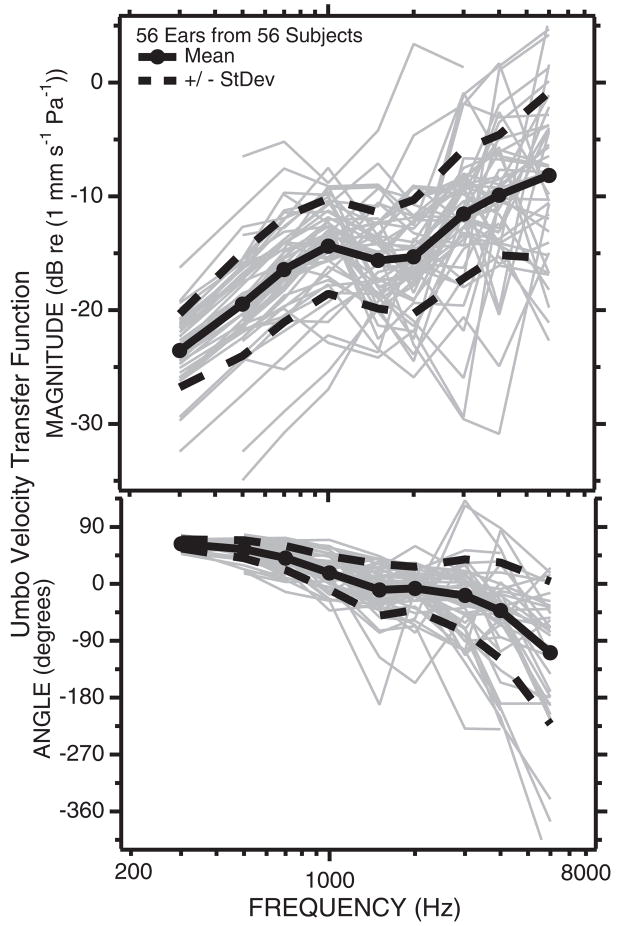
Fig. 3.
The umbo-velocity transfer function in 56 normally hearing ears. The gray lines are individual measurements of the dB magnitude (upper panel) and angle in degrees (lower panel) of a transfer function from one normally hearing ear in 56 subjects with at least one normal ear. Also illustrated are the means (filled circles and solid black lines) ± the standard deviations (dashed black lines) for the population. The ±6 dB standard deviation range in magnitude suggest that 66% of normal ears fall into a velocity range of the mean ± 6 dB. The standard deviation of the phase angle depends on stimulus frequency and increases as frequency increases (after Whittemore, Merchant, Poon, & Rosowski, 2004).

