Figure 4.
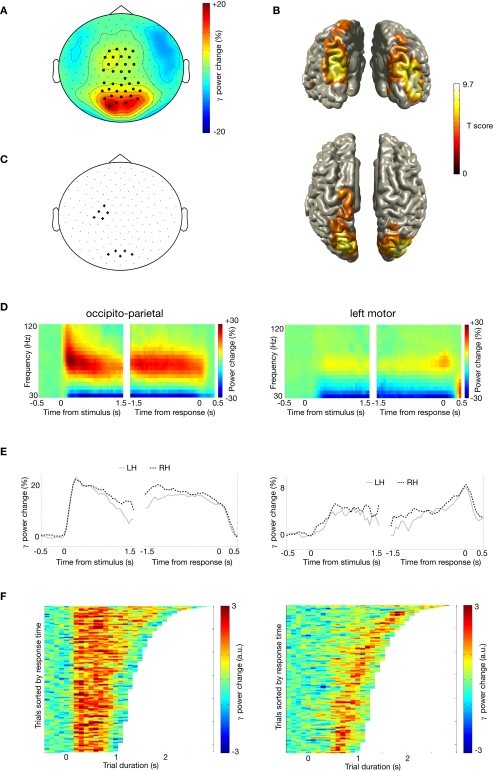
Gamma activity during motor imagery. (A) Grand average of the topography of gamma power (50–80 Hz), showing the relative comparison of task and baseline. Dots indicate clusters of significant differences (p < 0.05 corrected for multiple comparisons). (B) Source reconstruction of gamma power increase. Upper panel shows a posterior view, and lower panel shows a view from the top. Power of the source representations is thresholded at half-maximum. (C) Outline of a group of sensors overlying left motor cortex and occipito-parietal cortex that were selected for subsequent analysis. (D) Grand-averaged time-frequency representation of power of sensors overlying occipito-parietal cortex (left panel), and of a group of sensors overlying the left motor cortex (right panel). Both groups of sensors showed a significant gamma power increase during the task, but with different temporal profile. Sensor selection is outlined in (C). (E) Grand-averaged gamma power, averaged over 50–80 Hz, for the same sensor selection as in (D) (occipito-parietal sensors: left panel; left motor sensors: right panel), plotted for left and right hands separately. (F) Relationship between trial duration and gamma increase. Gamma-band power, averaged over 50–80 Hz, for single trials (sorted by reaction time) is plotted against trial duration, for one representative subject and for the sensor selection as outlined in (C) (occipito-parietal sensors: left panel; left motor sensors: right panel). Power values were smoothed over 10 trial windows.

