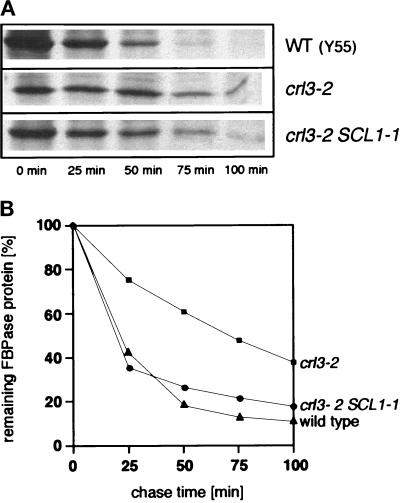
Figure 5.
Proteolytic stability of FBPase in crl3–2 and crl3–2 SCL1–1 mutants. (A) Pulse chase analysis of FBPase degradation in wild-type (Y55–1163), crl3–2 (Y55–1162), and crl3–2 SCL1–1 (Y55–1161) mutants. Cells were pulse labeled during derepression of FBPase in ethanol containing medium and chased with the addition of glucose followed by extraction, immunoprecipitation, and SDS-PAGE (see MATERIALS AND METHODS). (B) Quantitation of pulse chase analysis of wild-type cells (▴), crl3–2 (▪), and crl3–2 SCL1–1 (•) mutants.

