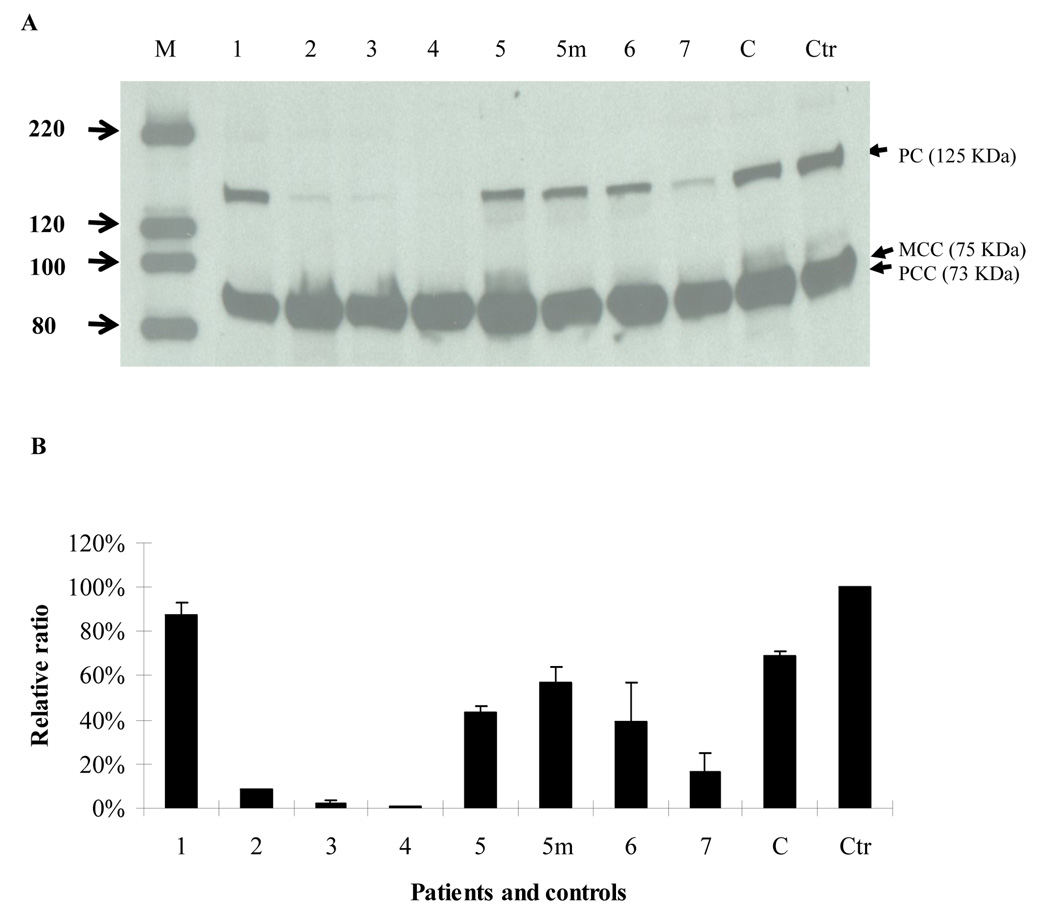
Fig. 4. Western blot analysis.
Western blot was done as described in the Materials and Methods section. The membrane was then probed with streptavidin-HRP conjugate. PC, MCC and PCC were visualized using the horseradish peroxidase ECL system (Amersham, Piscataway, NJ) following the protocol. C is a carrier control and Ctr is normal control. A. molecular weight markers and patient codes are shown on the top. 5m is the mother of patient 5. On the left side of the figure the molecular weight of each band in the marker are labeled with arrow heads (in KDa). The location of PC, MCC, and PCC are shown by arrow heads. B. the western blot was analyzed using Image J. The density of PC protein was normalized by the total density of MCC and PCC, further normalized to the control (100%). The data are shown as mean ± SD, n =3.

