Figure 2.
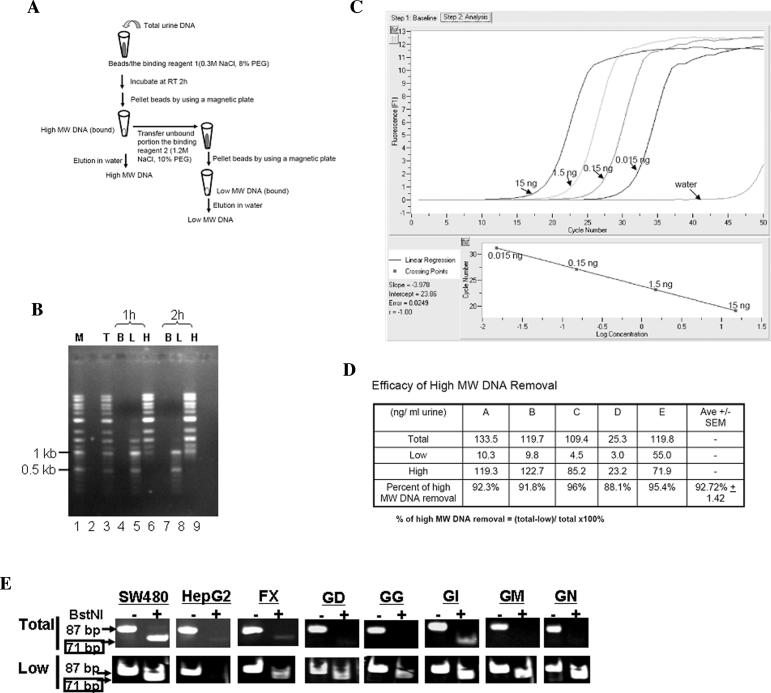
Preferential isolation of low-MW urine DNA from total urine DNA using carboxylated magnetic beads (CMBs). (A) Schematic outline of the isolation procedure. (B) Estimation of the efficiency of CMB binding to high- and low-MW DNA. DNA markers (a mix of 1-kb and 100-bp DNA markers, as mentioned in the text) were subjected to the procedure outlined in panel A for the separation of high-and low-MW DNA fractions using a 1-hour (1 h) or 2-hour (2 h) incubation time with binding reagent 1. After separation, the total input DNA (T), the beads (B), the low-MW DNA fraction (L), and the high-MW DNA fraction (H) were resolved in a 1% agarose gel, stained with ethidium bromide, and photographed under the UV transilluminator. (C) Real-time PCR amplification of the 18s primer set # 872. Serial dilutions of human genomic DNA (as indicated) were subjected to real-time PCR amplification with the 18s primer #872, as described in text, using LightCycler FastStart DNA Master SYBR Green kit (Roche Diagnostics) according to the manufacturer's specifications (except for the concentration of MgCl2, which was 3 mM). The time and temperature in each step of the real-time PCR were 94°C (10 sec), 55°C (5 sec), and 72°C (20 sec) for 45 cycles. The linear regression fit was plotted. (D) Efficacy of high-MW DNA removal. Urine from five volunteers was collected and subjected to total urine DNA isolation as described previously.1 Half of total urine DNA was fractionated into high-and low-MW DNA fractions as outlined in panel A. The amount of high-MW DNA in each fraction was quantified by real-time PCR using 18s primers #872 as described in panel C. The percent of high-MW DNA removal was calculated as noted. (E) Detection of mutated K-ras DNA in low-MW urine DNA. Total and low-MW urine DNA were prepared as described in text and subjected to the RE-PCR assay for mutated K-ras DNA. The photos shown represent the difference in the outcome of RE-PCR between total and low-MW urine DNA from the same individuals listed in Table 1.

