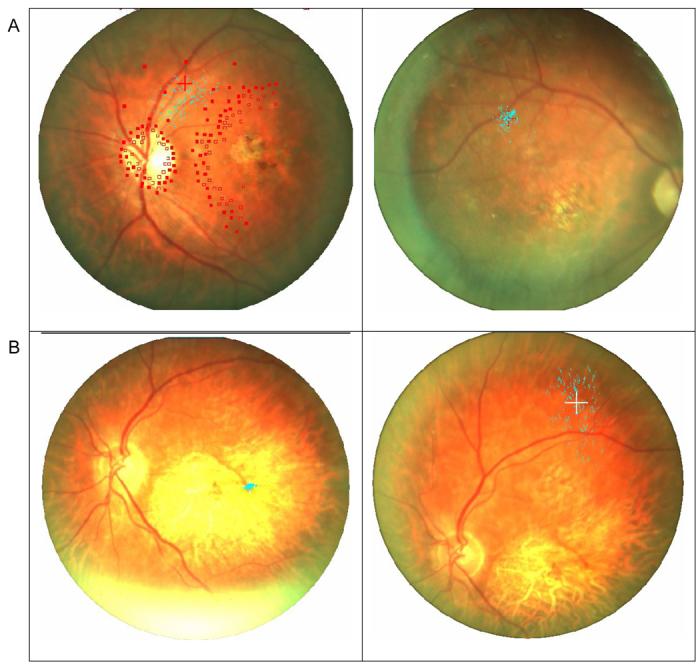
Figure 1.

Samples of fixation stability measured with the Nidek MP-1. The blue dots represent 900 samples of the position of the fixation cross on the retina. A (Left). MD3's PRL fixation stability taken during an extended session of static perimetry (open squares represent invisible targets and filled square visible ones). Even during this extended and attention requiring task, fixation was stable (45% of the samples within 4 degrees), and the fixation cross was never closer than 10 degrees from the fovea. A (Right). MD3's PRL fixation stability during the fixation task (shown with the right eye to illustrate the correspondence of the PRLs between the eyes) was more stable (94% of the samples within 4 degrees). B (Left). MD7's central fixation stability with the residual left fovea demonstrating normal foveal fixation stability where 100% of the samples were within 4 degrees. B (Right). MD7's PRL fixation stability for the same subject was much less stable (26% of the samples within 4 degrees), yet it is obvious that the fixation cross was never closer than 10 degrees from the fovea.
