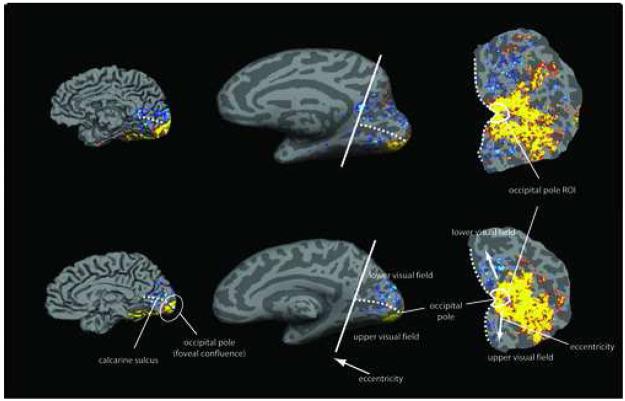
Figure 2.
Cortical flattening and the occipital cortical patch. Examples of cortical flattening in two control participants (top row, control for MD3; bottom row, control for MD5) showing the relationship between functional activation for foveal stimuli and the anatomically defined occipital pole ROI (white outline on flattened patch). The overlaid activation maps show areas with significantly greater activation for visual objects (top row, 3 × 3 degrees; bottom row, 3 × 4 degrees) presented at the fovea compared with a fixation baseline. The flattened representations of the occipital lobe were produced by first inflating the cortex, unfolding the sulci and gyri. A cut was then made along the fundus of the calcarine sulcus and the posterior cortex (including the occipital lobe) separated from the rest of the brain. Next, the occipital lobe patch was then flattened to produce the representations on which we displayed the activation data. The foveal confluence lies at the posterior end of the calcarine sulcus, near the occipital pole and is at the apex of the cut on the flattened cortical patch. The anatomically defined occipital pole ROI clearly overlaps the activation produced by foveal stimuli. The fundus of the calcarine sulcus separates the cortical representations of the upper and lower visual field. The representation of the lower visual field is dorsal to the fundus (above the foveal confluence on the patch), while the representation of the upper visual field is ventral to the fundus (below the foveal confluence on the patch). The eccentricity of the cortical representation increases as you move anteriorly from the posterior end of the calcarine sulcus (moving away from the foveal confluence on the patch in a direction parallel to the calcarine sulcus cut).

