
Figure 3.
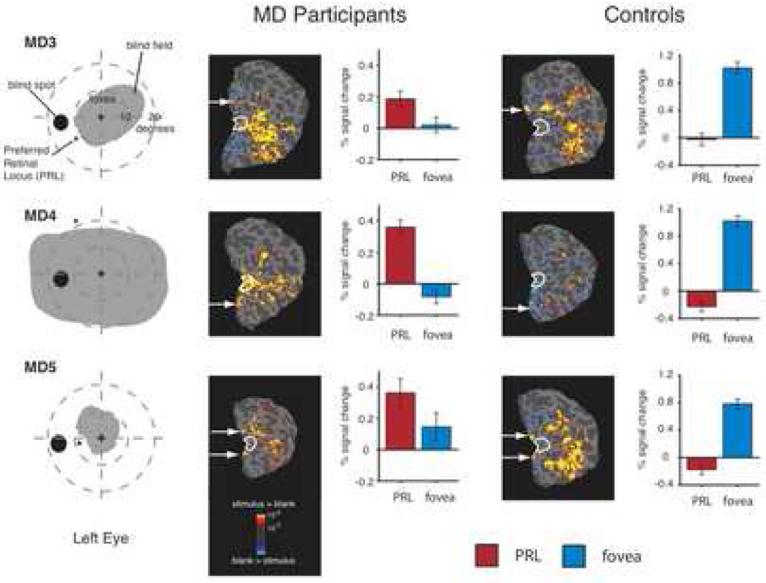
Large-scale reorganization of visual processing in three MD participants with extensive retinal lesions covering the fovea and matched control participants. Column 1. Schematic of visual fields in the left eye of each MD participant showing the large extent of the blind field (scotoma). MD3 and MD5 were tested with the right eye patched. MD4 was tested binocularly and the field loss in the right eye was very similar to that shown for the left eye. Column 2. Statistical parametric maps on the flattened cortex showing activation at the occipital pole (white outlines show the anatomically defined occipital pole ROI) for MD participants. The activation maps are displayed on the flattened cortex and show activation in response to visual objects presented at the PRL compared with the fixation baseline. In all three participants, the PRL was located in the left visual field, and data are shown for the right hemisphere only. In each case, activation was observed not only in parts of cortex corresponding to the retinal location of the PRL (white arrows), but also in the foveal confluence. Column 3. Bar charts showing percent signal change in the independently defined occipital pole ROI (white outlines). Stimuli presented at the PRL (red bars) elicited strong responses while stimuli presented at the fovea (blue bars) elicited little or no response. Column 4. Unlike the MD participants, in the control participants the flat maps show no activation at the occipital pole for stimuli presented to peripheral retina (corresponding to the matched MD participant's PRL). Column 5. Percent signal change in the occipital pole ROI for control participants shows a strong response to foveal stimuli but no response to peripheral stimuli.