
Figure 4.
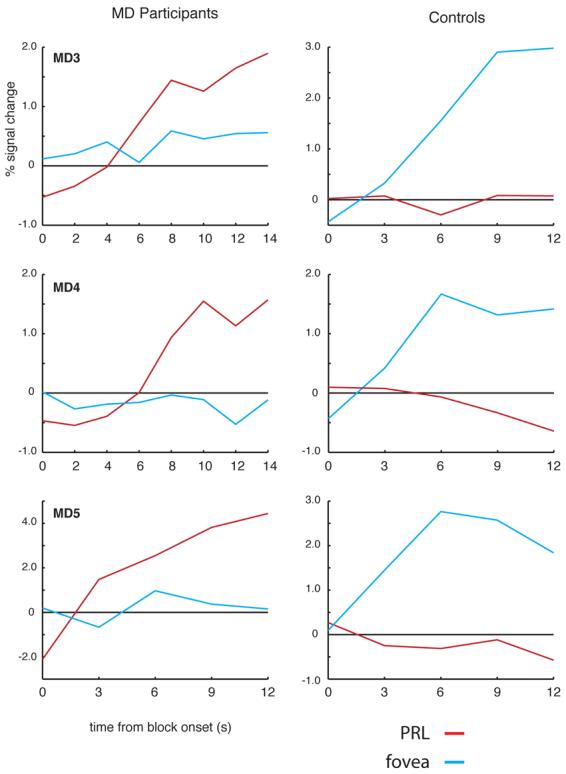
Time course of activation at the occipital pole ROI for MD3, MD4, MD5, and matched controls. Average time course of visually active voxels in the occipital pole ROI for MD participants (left column) and matched controls (right column). In each participant, voxels within the occipital pole ROI responsive to either foveal or peripheral stimuli (relative to fixation baseline) were selected using half of the total data collected. Independent time courses were plotted by averaging data from those voxels using the other half of the data. In each MD participant, there is a strong increase in activation relative to the fixation baseline for stimuli presented at the PRL (red lines) over the course of the blocks. In contrast stimuli presented at the fovea (blue lines) elicited little or no change in the activation over time. The opposite pattern was observed in the matched control participants: large increases in activation over the course of the blocks for foveal stimuli but no or even small decreases in activation over time for stimuli presented in the periphery.