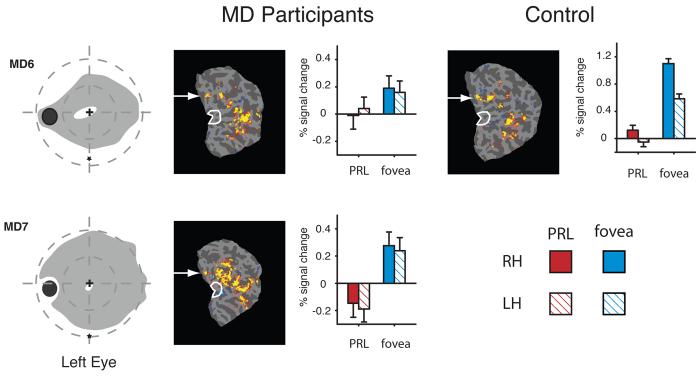
Figure 5.
Lack of large-scale reorganization in two MD participants with foveal sparing and a matched control participant. Column 1. Schematic of visual fields in the left eye of MD6 and MD7. Visual fields in the other eye for both patients were similar, both showing some residual central foveal vision. The right eye of each participant was patched. Column 2. Statistical parametric maps on the flattened cortex showing activation in both hemispheres in response to visual objects presented at the PRL compared with the fixation baseline. In both participants, the PRL was located on the vertical mid-line and ROI data are shown for both hemispheres. In both participants, while activation was observed in parts of cortex corresponding to the PRL location (white arrows), no activation was observed at the occipital pole. Column 3. Bar charts showing percent signal change in the occipital pole ROI in the left (light bars) and right (dark bars) hemispheres. Stimuli presented at the fovea (blue bars) elicited small but significant responses while stimuli presented at the PRL (red bars) elicited little or no response. Column 4. Statistical parametric map showing activation elicited by peripheral stimuli compared with the fixation baseline for matched control participant. Similar to MD6 and MD7, the flat maps show no activation at the occipital pole for stimuli presented to peripheral retina. Column 5. Percent signal change in the occipital pole ROI shows a strong response to foveal stimuli but no response to peripheral stimuli. Color scale for statistical parametric maps is the same as in Figure 3.

