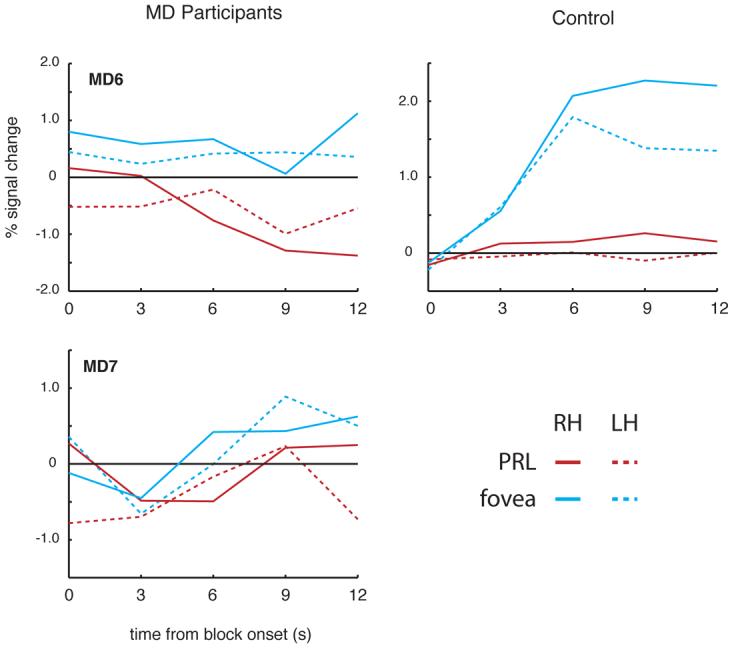
Figure 6.

Time course of activation at the occipital pole for MD6 and MD7 and matched control. In both MD participants (left column), stimuli presented at the fovea (blue lines) elicited weak increases in activation relative to the fixation baseline in both the right (solid lines) and left hemisphere (dotted lines). In contrast to MD3, MD4 and MD5, however, stimuli presented at the PRL (red lines) elicited weak decreases or little change in activation relative to fixation over the course of the blocks, and the activation for foveal stimuli was greater than for peripheral stimuli. In the matched control participant, while the change in activation for foveal stimuli was much stronger than in MD6 and MD7, since there was no damage to the fovea, the same qualitative pattern was observed.
