
Figure 2. Severing of actin filaments tethered (via CapZ) and attached (via HMM) to the glass surface.
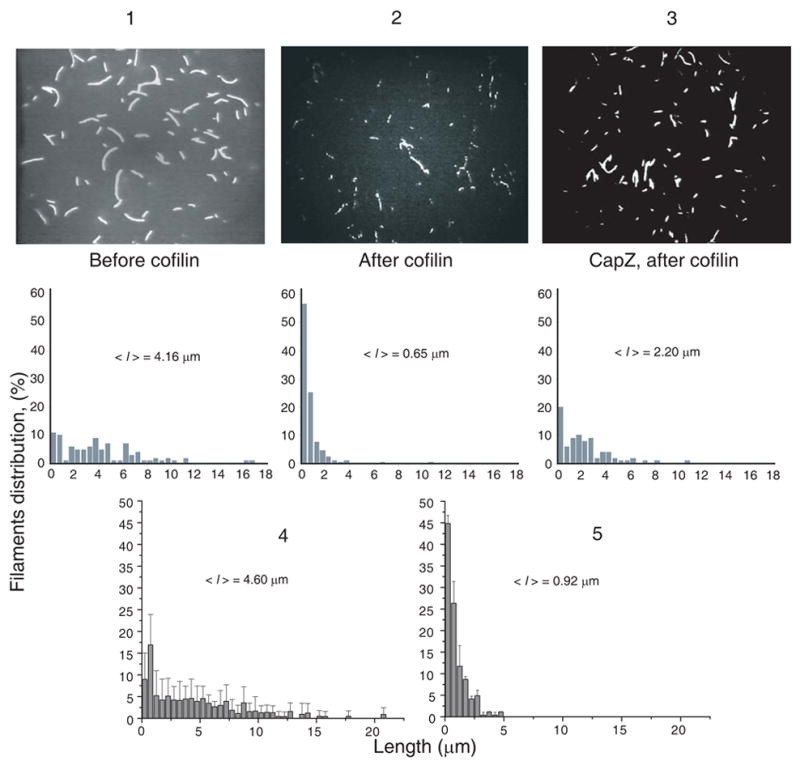
Several snapshots of TRC~F-actin being held by HMM (2) and CapZ (3) were taken before the addition of 50 nM cofilin (1) and after 2 minutes of incubation with cofilin at 25 °C and pH 8.0 (for filaments held to the surface by HMM (2) and CapZ (3)). Snapshot images of TRC~F-actin filaments were enhanced and processed using the Sigma Scan Pro 5 image analysis program. The length of at least 150 filaments was measured in each case after the screen was calibrated using a grid-containing slide. Length distributions were plotted in lower panels 1–3. The mean filament length was 2–3 times smaller when the severed filaments were attached to the surface by HMM (2) rather than tethered via their barbed ends to CapZ (3). Length distributions are shown also for TRC-F-actin filaments co-polymerized from 25% fully labeled TRC-G-actin and 75% unlabeled G-actin before the addition of 20 nM cofilin (4) and after their incubation with 20 nM cofilin for 2 minutes at 25°C and pH 8.0 (5).