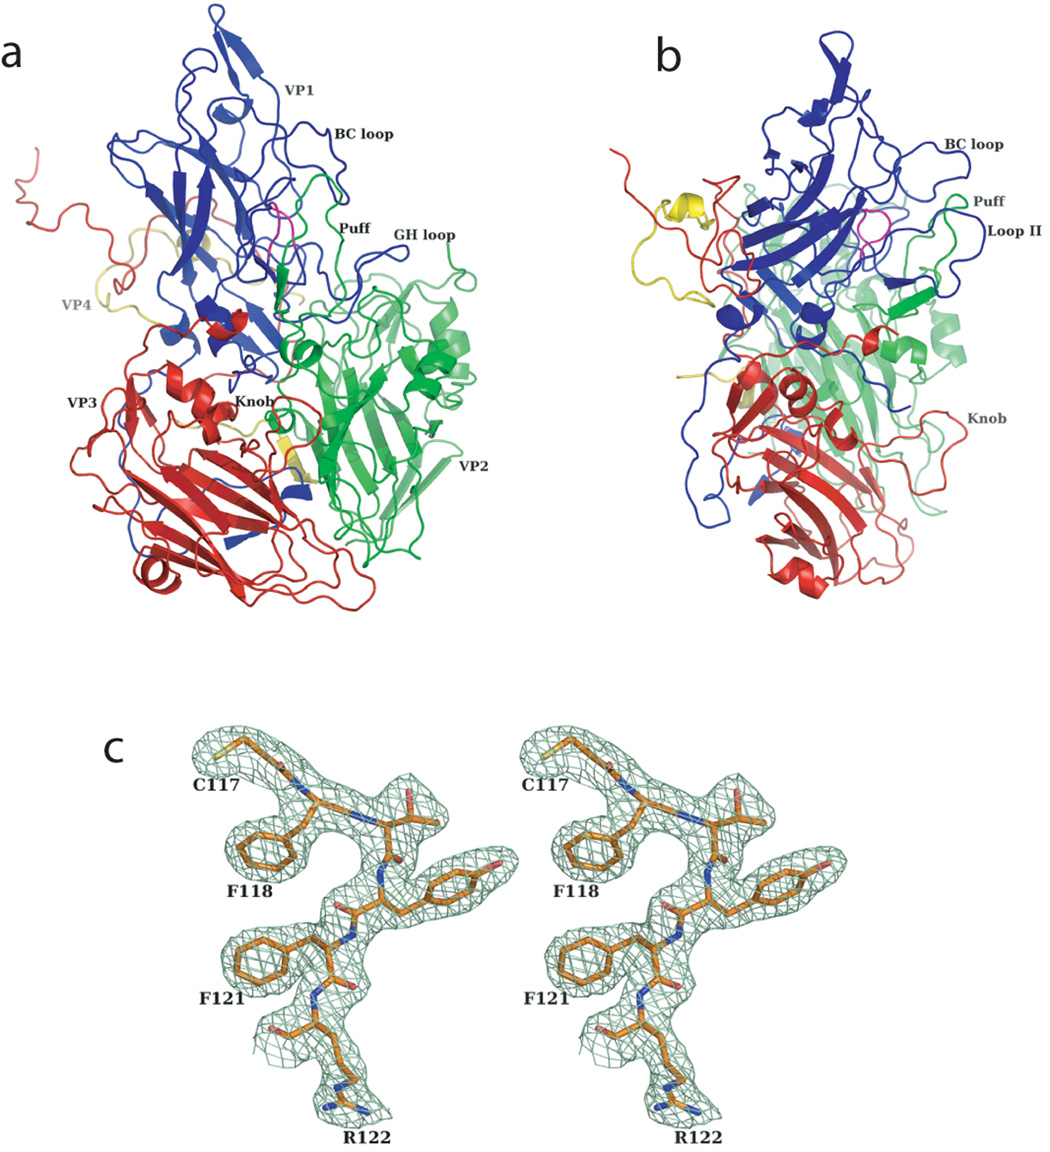
Figure 1.
Protomer structure and the quality of the electron density map of SVV-001. Ribbon diagrams of SVV-001 protomer, (a) front view and (b) a side view, highlighting the different subunits and the prominent surface loops. VP1, VP2, VP3 and VP4 subunits are shown in blue, green, red and yellow respectively. (c) Stereo diagram showing the quality of the NCS averaged electron density map at 2.3Å resolution, contoured at 1.2σ.

