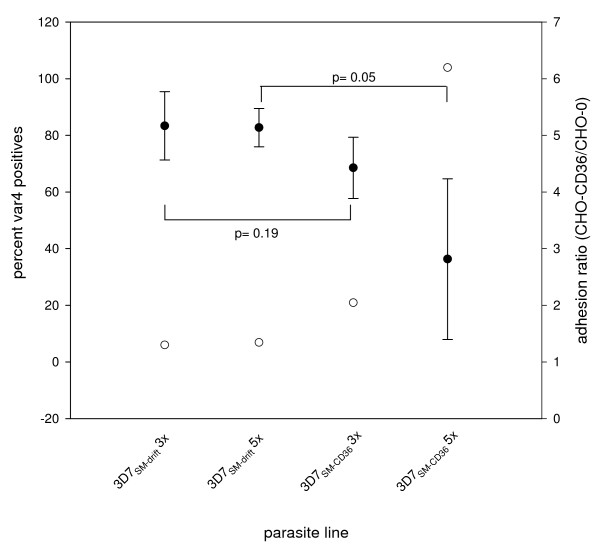
Figure 2.
VAR4 surface expression in 3D7SM-drift and 3D7SM-CD36 in 3 replicate experiments correlated with CD36 adhesion. Left Y-axis, solid circles show mean percent VAR4 positives of 3D7SM-drift and 3D7SM-CD36 following three (3×) and five (5×) rounds of gelatine flotation or selections for binding to CD36 of three replicate experiments. Standard deviations are shown as error bars. The 3D7 sublines were not frozen nor thawed for the first replicate experiment prior to determination of VAR4 surface expression. For the second and third replicate experiments there was prior freezing, thawing, and in vitro culture of the 3D7 sublines. p values ≤ 0.05 were considered significantly different. Right Y-axis, open circles show adhesion ratio of the different 3D7 sublines. Adhesion ratio is calculated as percent adhesion to CHO-CD36 over percent adhesion to CHO-wild type.

