
Figure 3. Temporal progression of the morphology of GFP-positive axon terminals in the CA3 area.
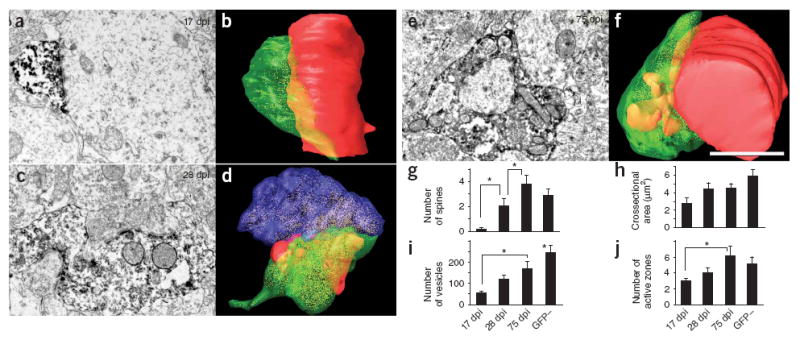
(a,b) At 17 dpi, small boutons contacted dendritic shafts. (c,d) At 28 dpi, GFP-positive larger mossy terminals contacted thorny excrescences that were also contacted by GFP-negative mossy terminals. (e,f) At 75 dpi, mossy terminals contacted individual thorny excrescences. The boutons shown in the electron micrographs in a, c and e were serially sectioned and three-dimensionally reconstructed in b, d and f. Scale bar represents 1.5 μm. Green, GFP-positive bouton; red, dendrites and spines that synapsed with the GFP-positive boutons; blue, unlabeled axon terminal that shared postsynaptic targets with the GFP-positive bouton. (g) Number of spines indenting into GFP-positive boutons, as observed on the largest section. The number at 17 dpi was significantly smaller than at any other time point (t (31) = 6.85, P = 0.01, Fisher’s PLSD; 17 versus 28 dpi, P = 0.03; 28 versus 75 dpi, P = 0.03; 75 dpi versus GFP-negative boutons, P = 0.25). (h) Cross-sectional area of GFP-positive boutons at the largest section (t (31) = 3.62, P = 0.02). (i) Number of presynaptic vesicles in the largest section (t (31) = 7.02, P < 0.001, Fisher’s PLSD; 17 versus 75 dpi, P = 0.01; 17 dpi versus GFP-negative, P < 0.001; 28 dpi versus GFP-negative, P < 0.005; 75 dpi versus GFP-negative, P < 0.05). (j) Number of active zones in the largest section (t (31) = 2.08, P = 0.12, Fisher’s PLSD; 17 versus 75 dpi, P < 0.05). * P < 0.05. Data are presented as means ± s.e.m.