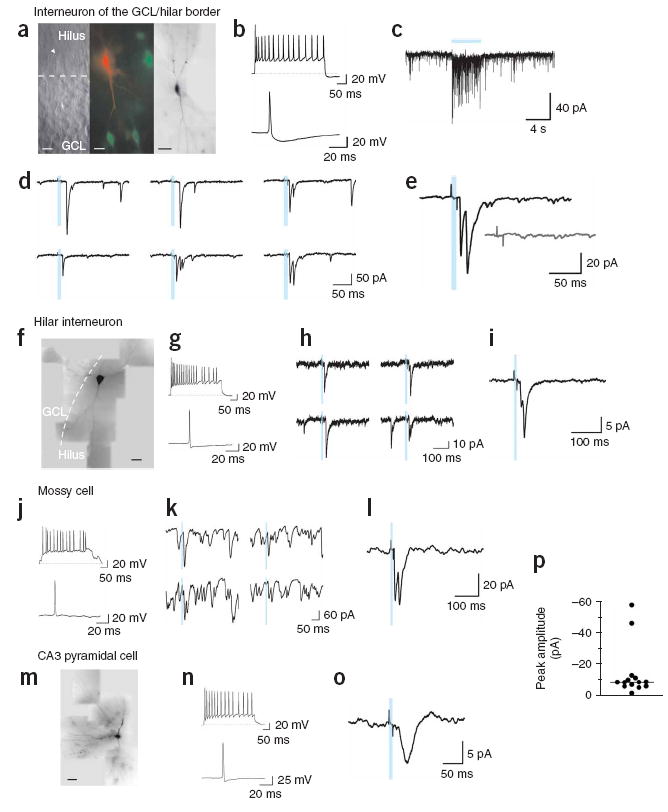
Figure 4. Light-evoked neurotransmitter release from adult-born neurons expressing ChR2.

(a–e) GCL/hilar border interneuron. (a) Left, infrared microscopy of a patched neuron (arrowhead). The dashed line divides GCL from hilus. Middle, merged images showing the patched neuron filled with Alexa Fluor 543 (red) and ChR2-GFP-positive granule cells (green). Right, reconstruction of the filled neuron showing bipolar morphology, with dendrites extending toward the GCL and hilus. Scale bars represent 20 μm (left, middle) and 50 μm (right). (b) Top, 40-Hz spike train in response to a 750-pA pulse. Bottom, spike elicited by a 50-pA current. (c) Synaptic activity evoked by a prolonged light stimulus (blue bar). (d) Example PSCs elicited by 10-ms light stimuli (blue bars) delivered at 0.2 Hz. (e) Average of 45 responses. PSC delay to onset was 15.2 ms and failure probability of first peak was 0.36. Inset, average of 38 traces evoked with a blocked light path. (f–i) Hilar interneuron. (f) Dye-filled neuron with multipolar morphology and dendrites extending through the hilus and GCL. Scale bar represents 50 μm. (g) Top, 50-Hz spike train in response to 700 pA. Bottom, spike elicited by 50 pA. (h) Example PSCs. (i) Average of 179 responses to repeated stimuli (1 Hz). The PSC delay was 21.9 ms and the failure probability was 0.56. (j–l) Hilar mossy cell. (j) Top, 35-Hz spike train in response to 250 pA. Bottom, spike elicited by 100 pA. (k) Example PSCs showing high frequency of spontaneous synaptic activity. (l) Average of 445 PSCs (1 Hz). PSC onset was 14.2 ms. (m–o) CA3 pyramidal cell. (m) Filled neuron showing the soma in the CA3 pyramidal layer, with basal and apical dendrites. Scale bar represents 50 μm. (n) Top, 35-Hz spike train in response to 350 pA. Bottom: spike in response to 50 pA. (o) Average of 400 PSCs (1 Hz). PSC onset was 25.1 ms. (p) Average peak amplitude of all light-evoked PSCs (n = 14 cells). The horizontal line denotes the median.
