
Figure 5. Pharmacological treatments demonstrate glutamate release by adult-born neurons.
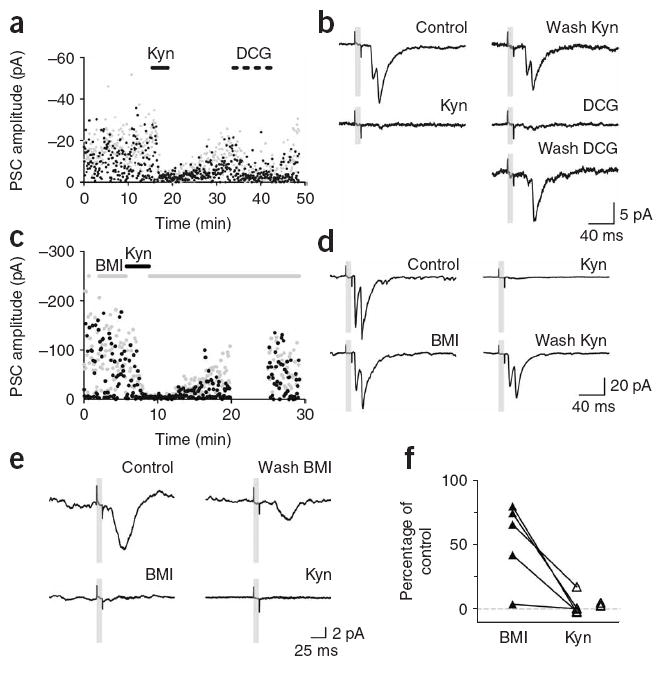
(a) Amplitude of the first and second peak (black and gray dots) of PSCs evoked by repetitive light pulses (0.2 Hz). Application of 10 mM Kyn and DCG-IV (DCG, 1 μM) is indicated by the solid and dotted bars. DCG increased failure probability from 0.27 to 0.85 (same cell as in Fig. 4f–i). (b) Consecutive average traces from the experiment shown in a, taken before, during or after the indicated treatments. (c) Amplitude of the first and second peak of single light-evoked PSCs (0.2-Hz stimulation). Application of 20 μM BMI and 4 mM Kyn is indicated by the gray and black horizontal bars (acquisition was interrupted from 20–25 min; same cell as in Fig. 2a–e). (d) Consecutive average traces from the experiment shown in d, taken before, during or after the indicated treatments. (e) Pharmacology of light-evoked PSCs on a pyramidal cell. Consecutive average traces show a full blockade of PSCs by BMI, partial recovery after drug washout and then full blockade by Kyn. (f) Amplitude of light-evoked PSCs in the presence of BMI (n = 5) or Kyn (n = 8) relative to their amplitude without drugs. Lines connect values obtained in the same neurons. Experiments where BMI was not applied are shown to the right.