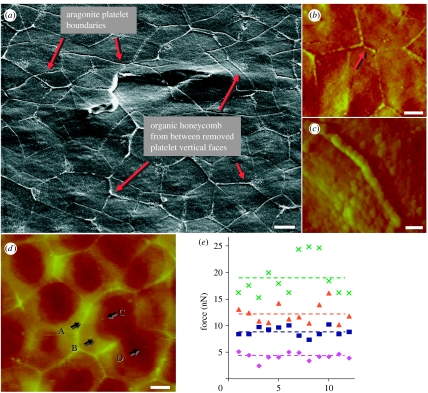
Figure 6.
(a) SEM image of the exposed nacre surface, revealing that organic layers from between the vertical faces of the removed aragonite platelets remain and form honeycomb-like outlines, effectively allowing the imaging of platelet boundaries from two adjacent layers at once. Two paired screw dislocation cores can also be seen. (b) AFM images showing honeycomb-like outlines similar to those in (a), revealing in (c) that the outline wall consists of a single layer of molecules with a diameter significantly larger than those in the surrounding matrix, and (d) demonstrating four surface layers classified by height, marked as A, border; B, top layer; C, middle layer; and D, bottom layer. (e) A comparison of experimental data of critical pulling force collected at 12 different locations in those four regions (scale bar, 2 μm in (a,b,d) and 500 nm in (c)). Diamonds, border; squares, mid layer; triangles, top layer; crosses, bottom layer; pink dashed line, border average; blue dashed line, mid-layer average; orange dashed line, top layer average; green dashed line, bottom layer average.

