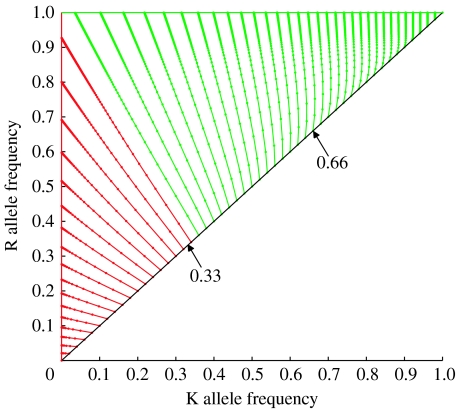
Figure 2.
The relationship between the initial frequency of the released killer–rescue strain and the trajectory towards equilibrium of the killer and rescue allele frequencies. The fitness costs of K and R are set at zero. The allele frequencies in successive generations are depicted as dots, with the lines joining the dots to aid visualization of the trajectories. (The closer the dots are along a line, the less is the change in the gamete frequencies per generation; so, as the equilibrium is approached, the dots appear to overlap.) The R fixed line of equilibria is shown as a solid green line and the K absent line of equilibria as a solid red line. Trajectories are coloured red or green, according to which of these two outcomes occurs in the long term. Initial conditions lie on the solid black line.

