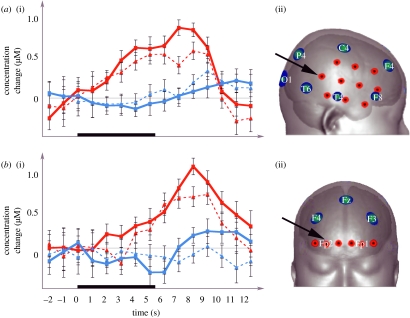
Figure 2.
Haemodynamic responses (i) measured by NIRS in experiment 1; (a) right superior posterior temporal cortex and (b) right fronto-polar cortex. Red squares, oxyHb (mutual); red triangles, oxyHb (averted); blue squares, deoxyHb (mutual); blue triangles, deoxyHb (averted). The thick black line on the time axis represents the duration during which the face stimuli were presented. (ii) NIRS channel layout (red circles) is shown on scalp surface with reference to a 10–20 system of EEG electrode placement (blue circles represent electrode positions) and approximate underlying cortical structures (Okamoto et al. 2004). Channels for which the time course is presented are marked by an arrow.

