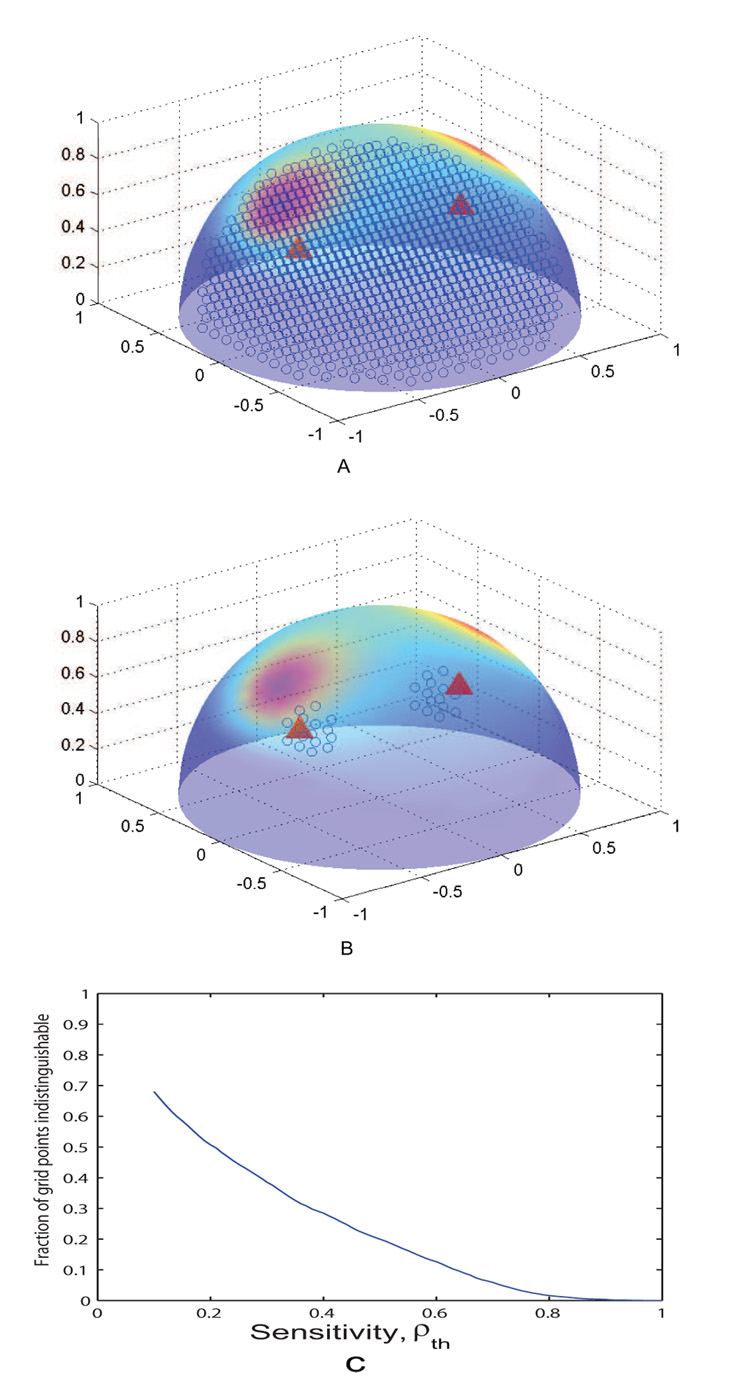
Fig. 3.
Spatial sensitivity analysis of the forward solution: A) Blue circles show all locations in the cortical volume at which the forward solutions are calculated, red triangles show the source locations and their scalp projection mapped onto a half-sphere B) For ρth = 0.9, blue circles show the blind locations where an additional source cannot be resolved. C) Effect of the sensitivity ρ on the ability of MLCS to distinguish additional network locations. At the limit case of ρth = 1, almost all the locations are resolved

