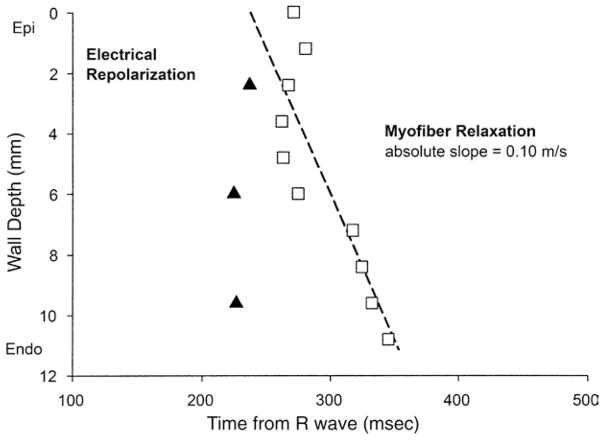
Figure 7. Electrical Repolarization and the Onset of Myofiber Relaxation Versus Mean Wall Depth.
Closed triangles = electrical repolarization (n = 4) mean value at each depth (mm); open squares = onset of myofiber shortening (n = 14) mean value at each depth (mm). Abbreviations as in Figure 1.

