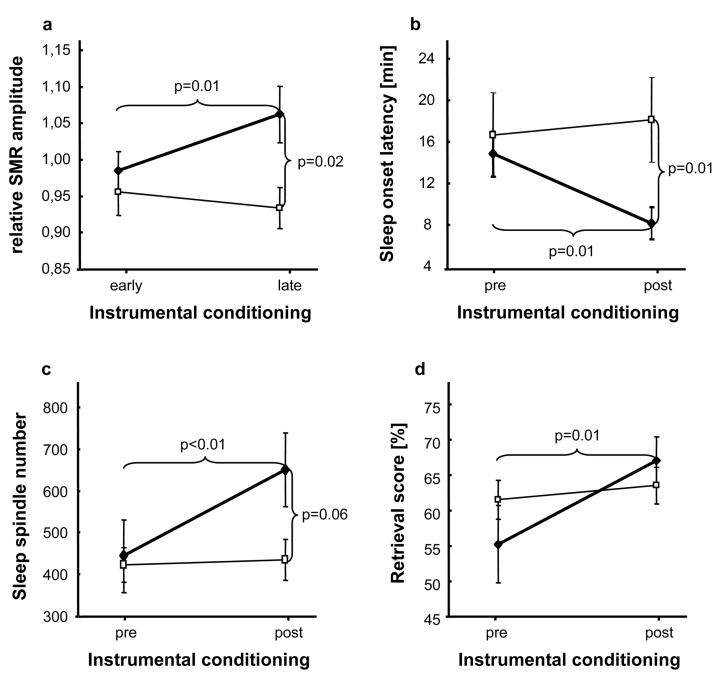
Figure 3.
2-way ANOVAs depicting differences between experimental (♦) and control (□) group.
a. Significant increase of relative SMR amplitude after ISC (experimental group) vs. randomized-frequency-conditioning (control group). b. Significant reduction of sleep onset latency during NAPpost compared to NAPpre. c. Significant increase of sleep spindle number from NAPpre to NAPpost. d. Significant enhancement of retrieval score computed at immediate cued recall (RET1) after ISC (experimental group) compared to randomized-frequency-conditioning (control group). Note that only 12–15 Hz conditioning (experimental group) could increase relative SMR amplitude, sleep spindle number, and retrieval score as well as decrease sleep onset latency. Error bars indicate standard errors of mean.

