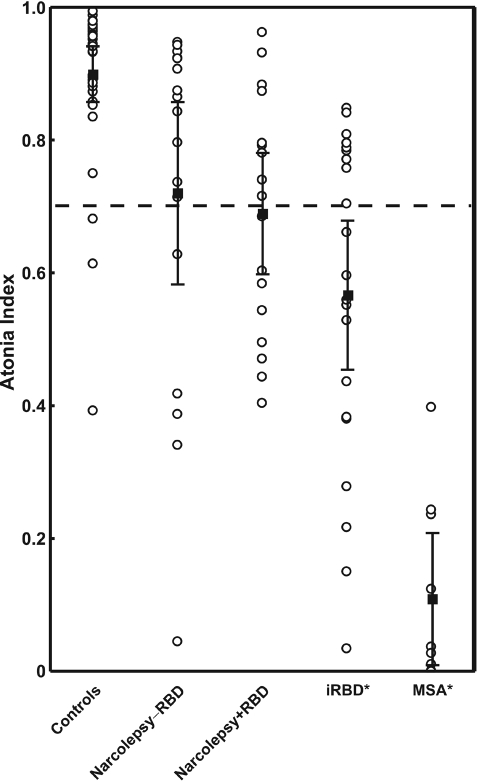
Figure 3.
REM sleep Atonia Index in the 3 groups of subjects in this study and in patients with idiopathic RBD (iRBD) and multiple system atrophy (MSA) (*data from Ferri et al.16): values are shown as means (black-filled squares) and 95% confidence intervals (whiskers). Individual values are also shown (circles).

