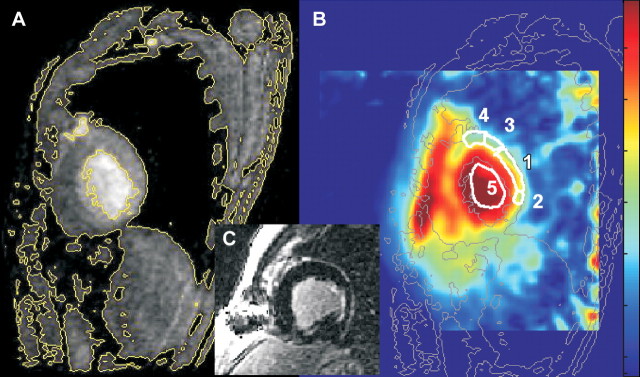
Figure 2:
Sagittal MR images in 53-year-old man with posterior MI show placements of ROIs for quantification of TSC. A, Fast gradient-echo 1H image (100/4.2, 90° flip angle, 36-cm field of view, 256 × 192 matrix, 5-mm section thickness) shows signal intensity level contours. The signal intensity level contours outlined in yellow are copied onto corresponding 23Na image (B) (85/0.4, 90° flip angle, 22-cm field of view, three-dimensional twisted spiral acquisition, 6-mm isotropic spatial resolution), where they are outlined in gray. In B, ROI 1 is MI used to calculate MI TSC (48 μmol/g wet weight in this patient); ROIs 2 and 3, adjacent posterior LV wall (TSC, 44 μmol/g wet weight); ROI 4, noninvolved (remote) LV wall (TSC, 39 μmol/g wet weight); and ROI 5, LV blood (TSC, 72 μmol/g wet weight). For display purposes, the color scale was designed to be approximately proportional to the sodium concentrations by using a calculated B1 map of the coil to correct for receiver coil sensitivity. C, Short-axis delayed contrast-enhanced image.

