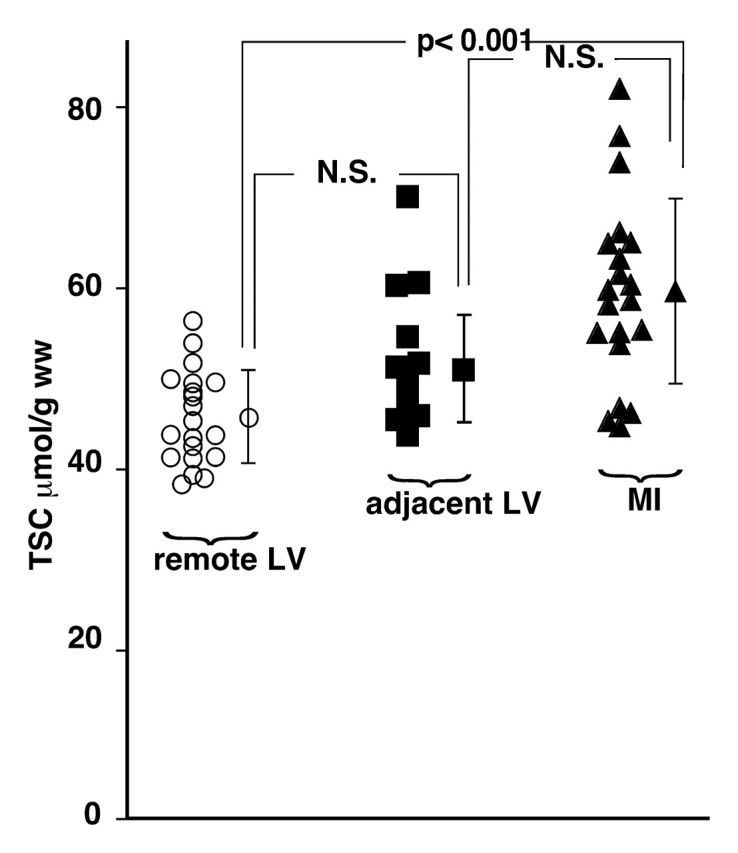
Figure 4:

Graph shows TSC values in MI in 20 patients, in adjacent LV tissue in 11 patients, and in remote LV tissue in 20 patients, with mean values ± 1 standard deviation. MI TSC is significantly increased compared with remote LV TSC, with Bonferroni correction (κ = 3, α = .017). Adjacent LV TSC does not differ significantly from remote region or MI values at similar analysis. N.S. = nonsignificant difference.
