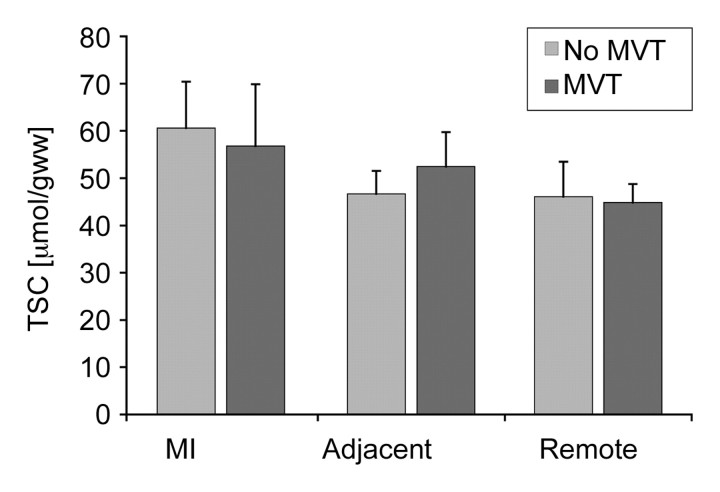
Figure 7:
Bar graph shows cardiac TSC in MI, adjacent LV tissue, and remote LV regions in nine patients in whom MVT was inducible at electrophysiologic testing and in seven patients in whom MVT was not inducible. For this analysis, adjacent LV tissue was assessed in five patients. Mean TSC in MI was 57 μmol/g wet weight ± 13 for nine patients in inducible group and 61 μmol/g wet weight ± 10 for seven patients in noninducible group (P> .05). Mean TSC in adjacent zones assessed in five patients was 54 μmol/g wet weight ± 14 for inducible group and 52 μmol/g wet weight ± 7 for noninducible group (P> .05). Mean TSC in remote myocardial tissue was 46 μmol/g wet weight ± 7 for nine patients in inducible group and 45 μmol/g wet weight ± 4 for seven patients in noninducible group (P> .05).

