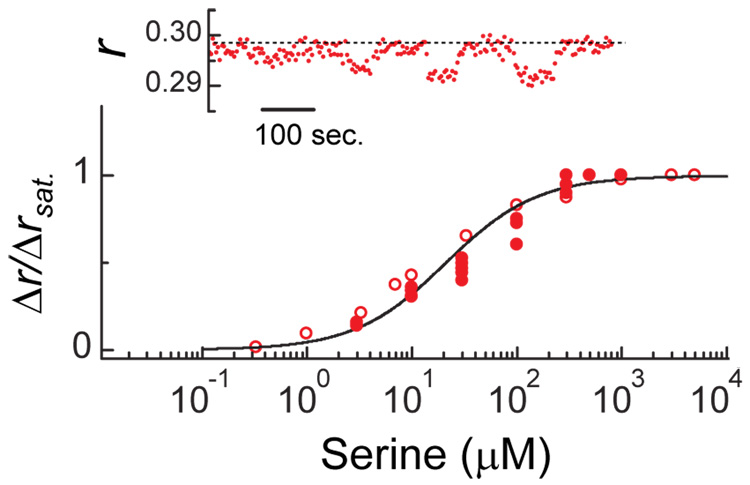
Figure 2.
The dependence of the downward anisotropy shift of Fig. 1b on the concentration of serine. The inset shows the raw data for one sequence with cells similar to those of Fig. 1b in which the concentration of serine was toggled between 0 and 10, 30, 100, and 300 µM, respectively; the dashed line indicates the anisotropy observed in the absence of ligand and is a guide to the eye. The main plot shows dose-response curves: closed symbols, results obtained from experiments of the kind shown in the inset; open symbols, results obtained from the same strain expressing only Tsr-YFP (induced using 5 µM IPTG from plasmid pAV29: pTrc99A vector carrying tsr–yfpA206K ); line, an in vitro binding curve of serine to Tsr (ref. 16: Kd=20 µM, Hill coefficient=1).

